
Monitoring
Create Module in Dashboard – Server Statistics
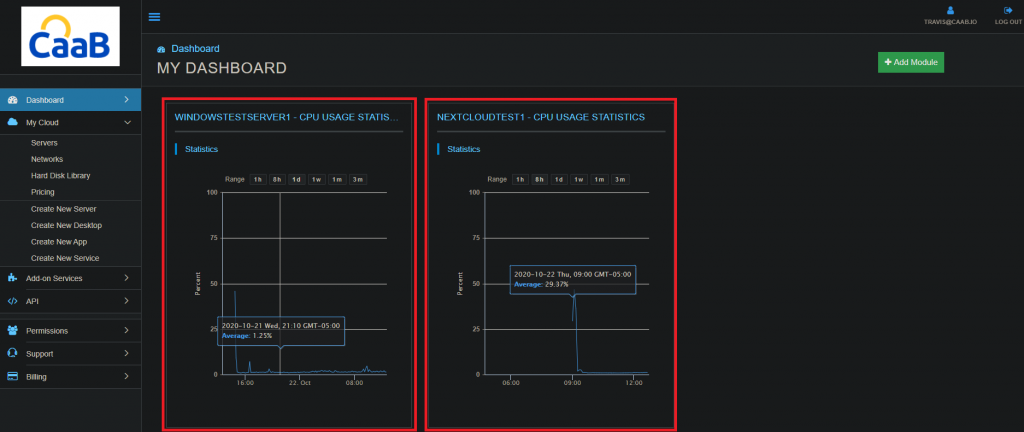
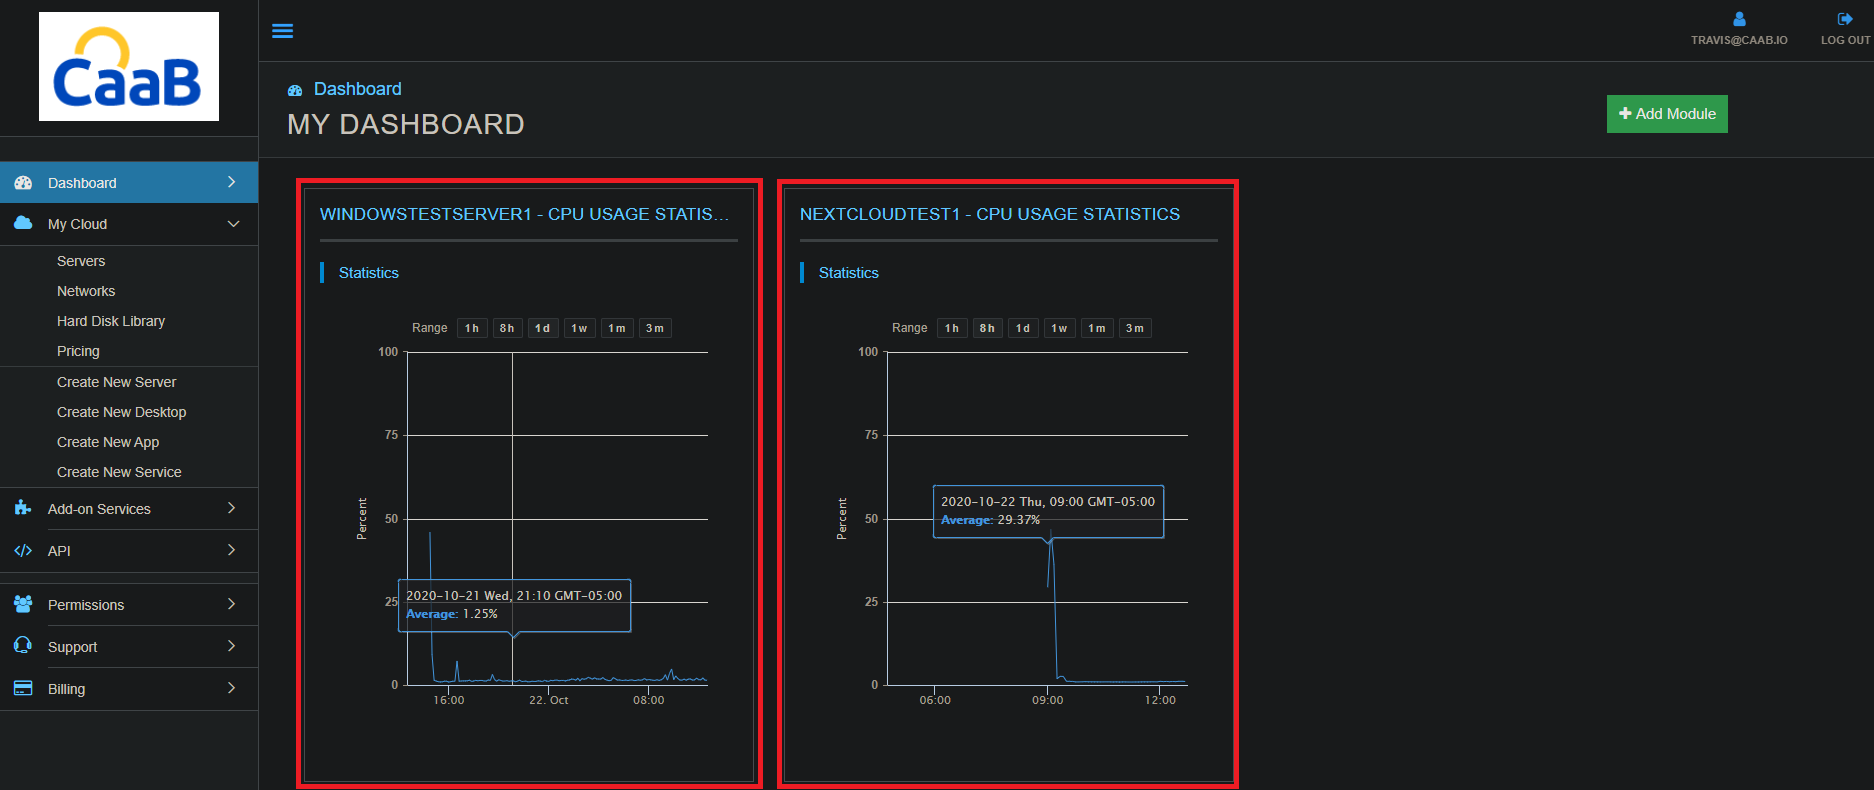
The Dashboard provides administrators comprehensive resource monitoring & visualization over server statistics, providing a snapshot view of bandwidth, performance, history, and utilization.
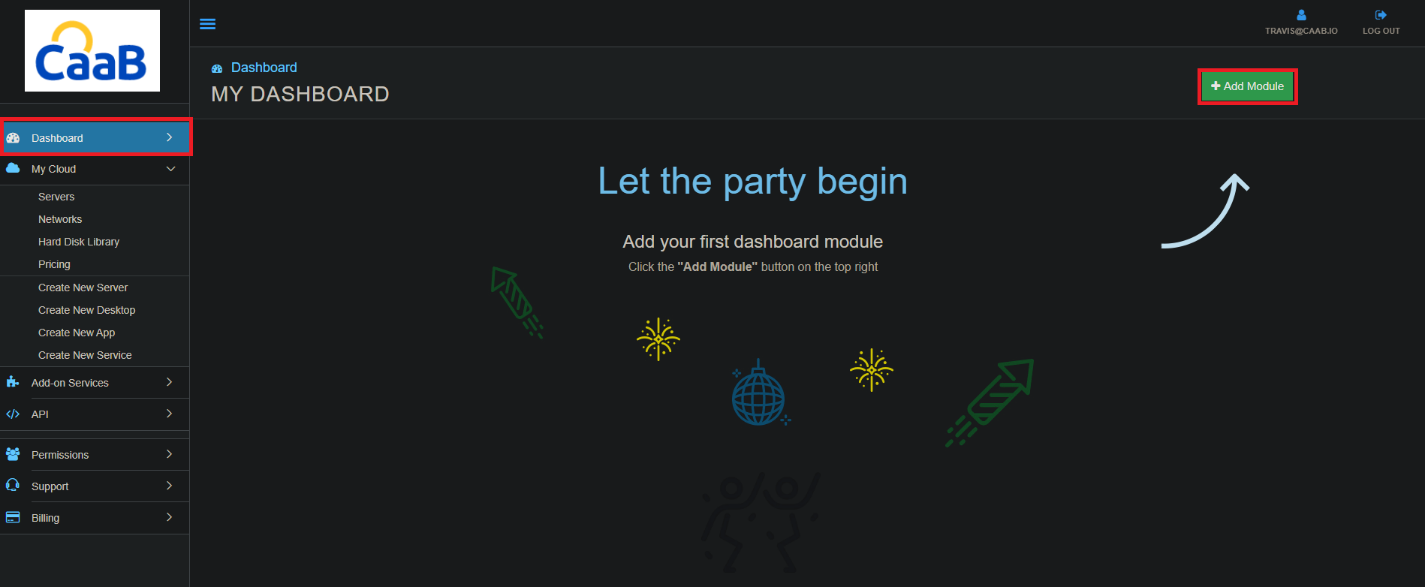
Create a module within Dashboard:
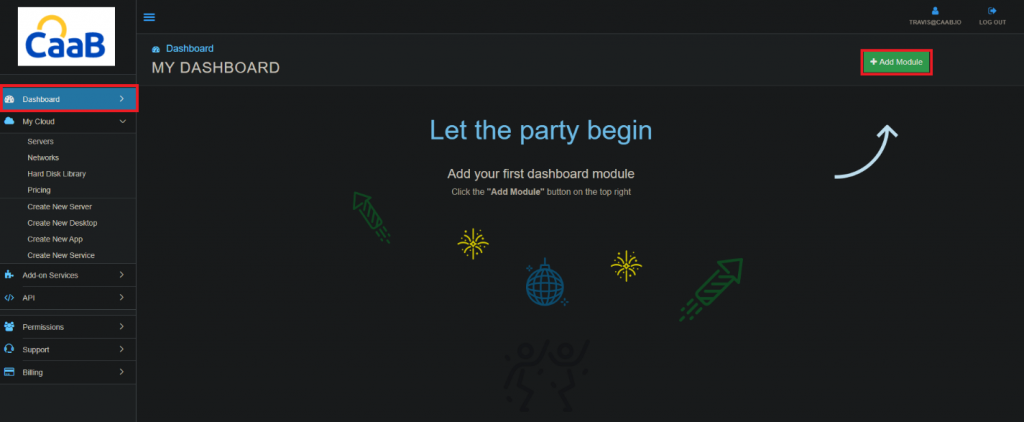
- From the administrative panel on the left side of the screen select “Dashboard”.
- In the top right section of the platform select “Add Module”.
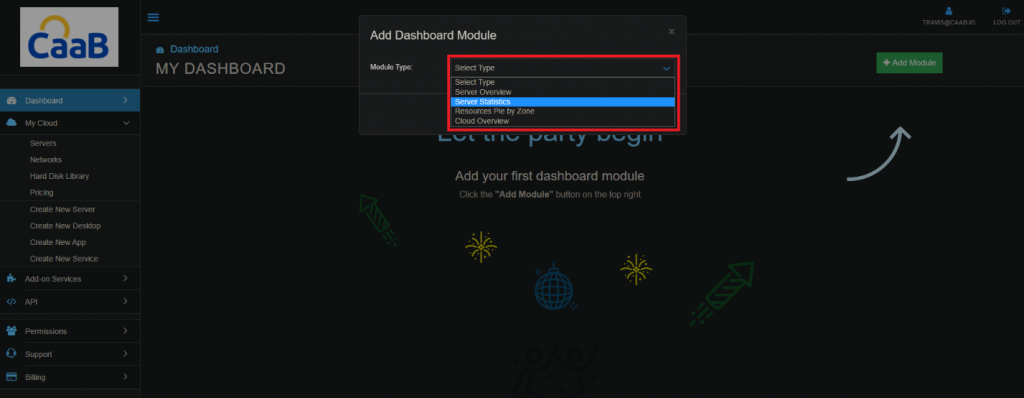
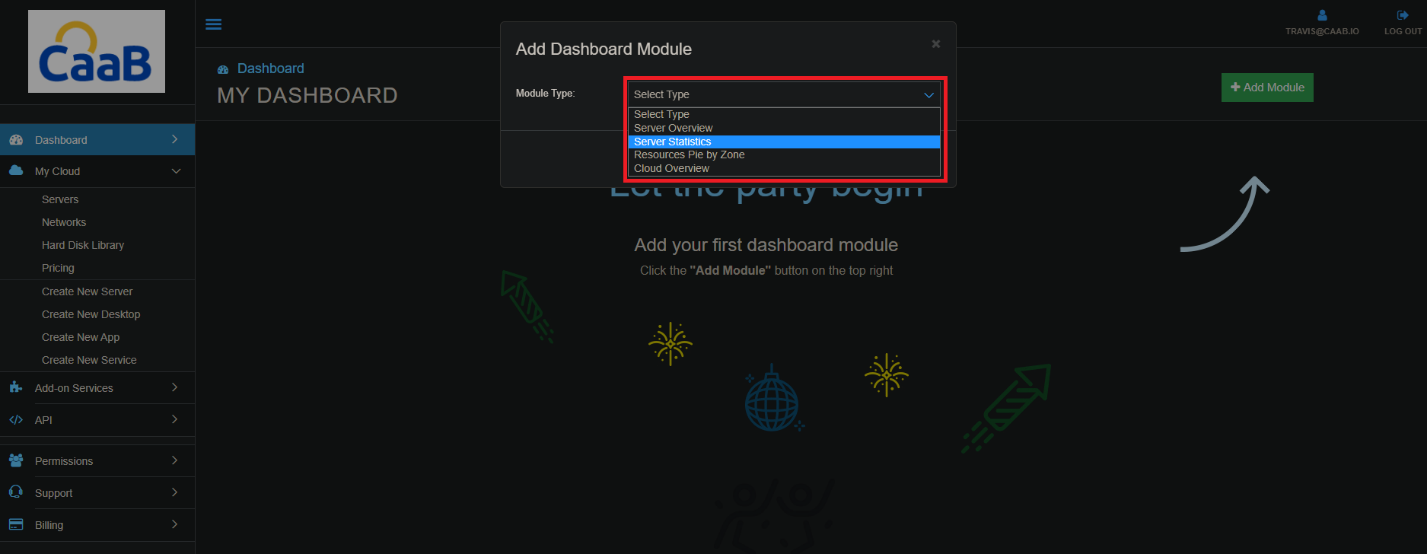
- An “Add Dashboard Module” window will appear in the middle of the screen. Click on the dropdown menu and select “Server Statistics”.
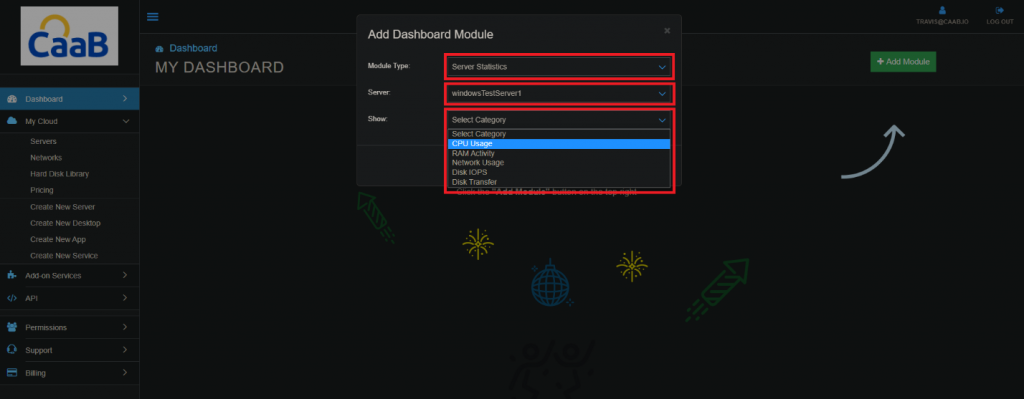
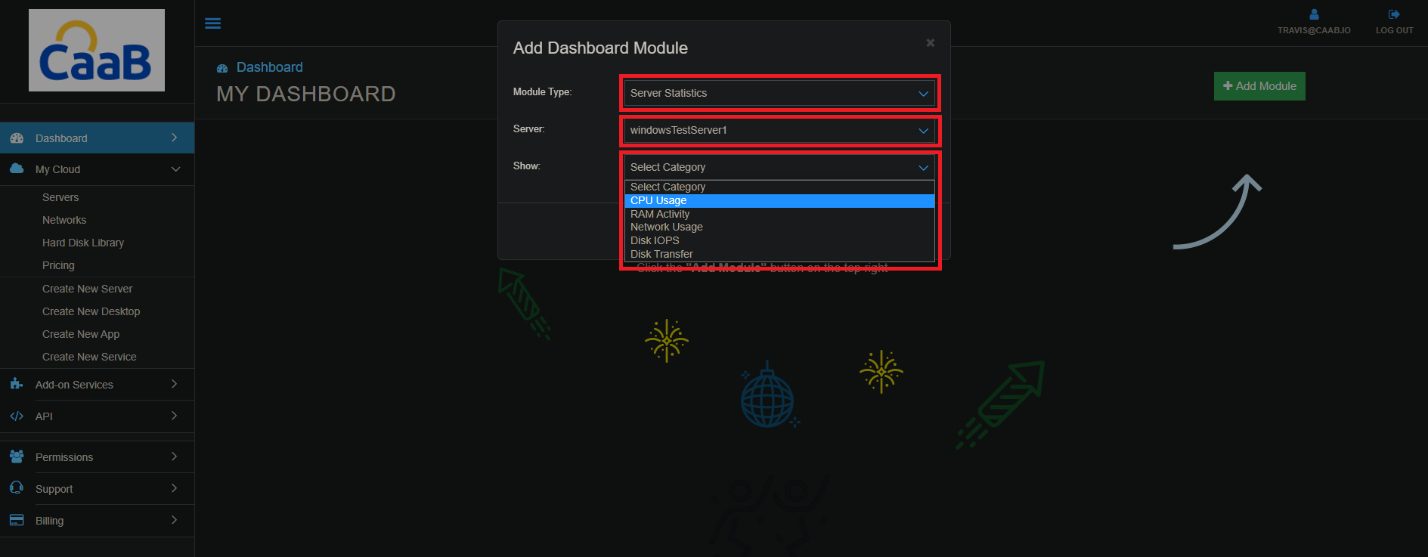
- Once Server Statistics is selected another dropdown menu will appear listing all accessible servers. From this menu select the sever you would like to add the module to and then select the specific server statistic (CPU/RAM/Storage/Disk IOPS/Network Usage/Etc.) from the following dropdown. Once the statistic is selected, click “Add Module”.
- All servers with “Server Statistics Modules” added will now appear directly in your Dashboard.
Technical Support
[email protected]
347-892-4733
Sales Inquiries
USA
646-558-2225
Canada
647-243-8771
Strategic Partnership Opportunities
[email protected]
Become a Reseller
[email protected]
