
Monitoring
Monitoring Server Resource Utilization Statistics
Server statistics can be monitored directly through the platform.
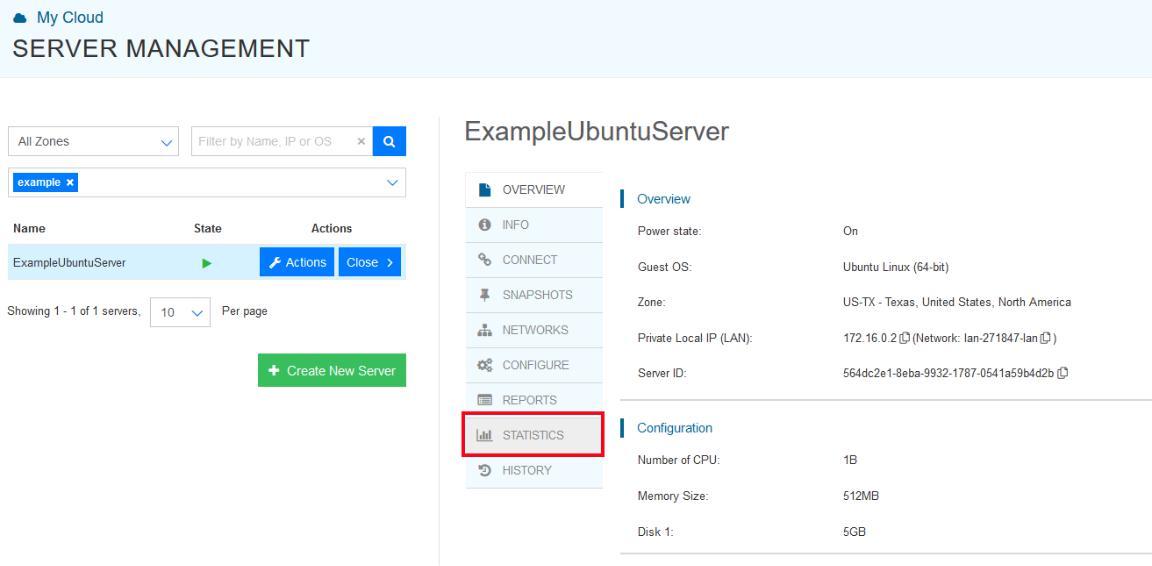
- Go to the “Servers” tab of the platform, which can be found under “My Cloud” in the left panel.
- Select “Open” under the server you’d like to view the statistics of, and then select “Statistics”.

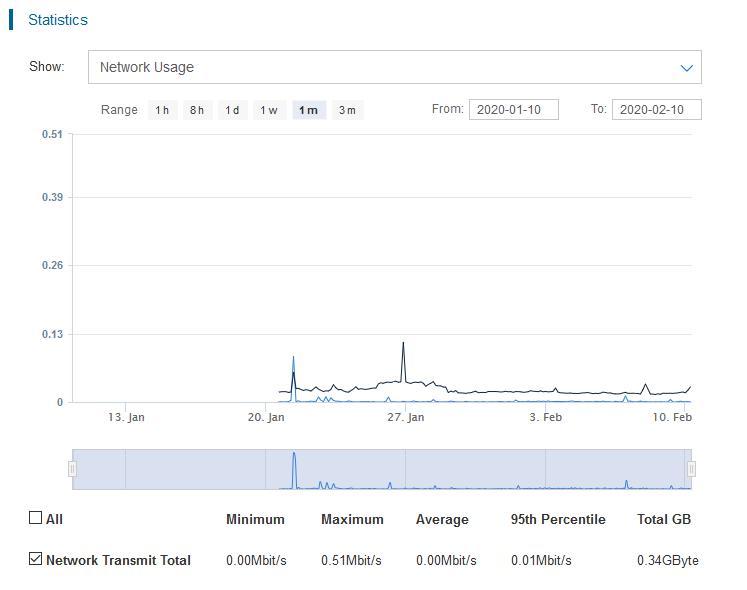
- Here you can view the detailed resource utilization statistics of the VM including CPU usage, RAM usage, advanced WAN and LAN transfer information, and disk transfer.
Technical Support
[email protected]
347-892-4733
Sales Inquiries
USA
646-558-2225
Canada
647-243-8771
Strategic Partnership Opportunities
[email protected]
Become a Reseller
[email protected]
